Sunday, February 24, 2013

Distance and Azimuth Survey

Introduction
The objective for this lab was to conduct a survey of point data in a quarter hectare using the distance and azimuth from a given origin.  Mitch Collins was assigned to be my partner for this project.  The point data could be collected in two different ways: using a range finder for the distance and a compass for the azimuth, or using a more high-tech TruPulse laser range finder that measures both.  This project was conducted in two parts.  The first was during class on February 18th, where the procedure, concepts, and equipment was introduced.  The final data collection occurred on February 24th with my partner.  In class, the concept of magnetic declination was discussed.  Magnetic declination is the angle between magnetic north (direction in which a compass points) and true north (direction in which the north pole is located along the Earth's axis).  Magnetic declination varies depending on the location on Earth, as well as over time.  It is important to be aware of and adjust for it because it affects navigation.  Here is a link to a webpage on the National Oceanic and Atmospheric Administration's website that calculates the magnetic declination based on location.
http://www.ngdc.noaa.gov/geomagmodels/Declination.jsp
The zip code for Eau Claire, WI was put in, and it was found that the city has a declination of 0° 58' W.  This is a very small declination, and means that magnetic north lies  0° 58' counter-clockwis of true north.  

Methodology

As mentioned before, the first part of this lab activity took place in the classroom, where the concepts and equipment were introduced.  After this, the class went outside behind Phillips Hall and practiced using the equipment to obtain the distance and azimuth of objects.  The location of this practice can be seen in Map 1. As you can see, this area is located between Phillips Hall and the parking lot.  In this area, the TruPulse laser rangefinder and a compass and sonic rangefinder were used to take points of objects such as trees, signs, and sculptures.  The tree near the corner of the building was designated as the origin.  The origin can be found using a GPS device, or by using a recognizable feature that can be found on a high resolution aerial image.
Map 1. Practice Run with Equipment for Distance and Azimuth Survey
The sonic rangefinders require two people for operation.  One person takes a unit and stands with it at the desired point and faces the other person with the receiver.  The person with the receiver then is able to find the distance between these two points.  They then must use a compass to find the azimuth.  The TruPulse laser rangefinders make this process much easier, as they can calculate many variables using different measurement modes.  In this lab, the azimuth, as well as the slope distance were the only relevant measurements.  The slope distance is the straight line distance between the TruPulse and the target object.  Although it was not used in this lab, the TruPulses also have a feature where data can be transferred via Bluetooth for mapping.

During this trial, each group got a turn using the equipment, and recorded the distance and azimuth for a few points.  This data was then stored in an Excel file brought into ArcMap.  Two tools were then used to transform the tabular data into points on a map that correctly model a position.  The first is Bearing Distance to Line, located under Data Management Features-->Features.  This tool creates a line representing the distance and azimuth from the origin.  When attempting to use this tool, many people in the class were having troubles.  Help menus were searched, and by trial and error, a solution was found.  The first step in this process is to create a geodatabase.  The Excel file must then be imported into that geodatabase.  To ensure accuracy, the cells containing the coordinates for the origin were formatted to show all of the decimal places.  After the Excel file was imported into the geodatabase, the Bearing Distance to Line tool was able to be used successfully. The final tool to be used was Feature Vertices to Points, also located under Data Management Features-->Features.  This tool placed a point at the end of each vertices that was created using the Bearing Distance to Line tool.  

On our actual survey day, Mitch and I chose to do an area at the edge of the Hibbard parking lot along State Street.
Map 2. Locator Map of Study Area of Parking Lot along State Street
    We chose a "No Parking" sign that was located at the end of a row of parking spaces as our origin.
Image 1. Location of Origin
 The TruPulse laser rangefinder was then used to measure the slope distance and azimuth of 50 points.  These points consisted of trees, bushes, stop lights, street signs, fire hydrants, and the front doors of houses.  
Image 2. View of State Street and Edge of Parking Lot from Origin
After the collection of the point data, an Excel file was created, and then brought into ArcMap.  This table can be seen in Table 1.  The table contains fields for the point number, X and Y coordinates for the origin, distance, azimuth, and point name.  An aerial image was loaded to find the coordinates for our origin.  
Table 1. Distance and Azimuth Data
The table was imported into a geodatabase that was created for this lab, and the Bearing Distance to Line tool was used.
Map 3. Results of the Bearing Distance to Line Tool
Map 3 depicts the line segments that were created representing the distance from the origin to the points.  The Feature Vertices to Points tool was then used to create points at the end of the line segments (Map 4).
Map 4. Results of the Feature Vertices to Points Tool 
A final map was then created to show the point locations of the objects where the distance and azimuth was measured.
Map 5. Final Map showing Point Data

Discussion
Our study area consisted of the end of the Hibbard parking lot, as well as the nearby areas along State Street and Garfield Avenue.  Our points consisted mainly of bare trees, bushing extending up from the snow, and street signs.  We also measured the slope distance and azimuth to the stop lights surrounding the intersection.  After examining Map 5, it was noticed that some of the points on the aerial image did not match up with the objects in real life.  Most of these points are located in the middle of State Street, which runs north to south on the map.  We did not take any points in the street, as most of the points were of trees or signs that were located along both sides of the street.  These points appear to be between five and ten meters away from their expected locations.  This might be attributed to the laser moving past a sign, tree, or bush and instead measuring the distance to a given spot on the road.  An error in the recording and entry of data could also attribute to this problem.  The point that is furthest north on the map certainly appears to be an outlier.  There also is the chance that the aerial image is slightly distorted and is the cause for some of the anomalies.       

The evolution of technology can be seen when examining the equipment that could be used to conduct a survey of points.  The first method described involves using sonic rangefinders and a compass.  This would require a second person to move to the desired points to collect the data.  It would not be a very fast and efficient method if only one person was sent to survey the area.  Another issue could be the precision with which the azimuth is measured using a compass.  Using the TruPulse was a much faster and easier method of conducting the survey.  It quickly switches between measurements modes to make a wide variety of measurements.  It also has Bluetooth to transfer data.  One of the downsides of a TruPulse is its expensive price.  These two methods have been in large part, become outdated by GPS technology.  GPS units allow a person to quickly move between objects and capture points.  These can then be easily transferred to a computer for analysis.  One of the negatives associated with using GPS is the idea that technology can fail a person at any time.  There could be software and equipment issues, or loss of power, making the understanding of low-tech methods of surveying important when in a bind.  GPS surveying is also not always an option due to location and topography.  An accurate signal is not always attainable near tall buildings or under tree cover.  Therefore, the use of a TruPulse laser rangefinder would be ideal for surveying objects in a forest or another area where a GPS signal is unreliable.

Conclusion

This lab was a great experience to see how surveying point data could be accomplished without the use of GPS technology.  This process has evolved from using sonic rangefinders and a compass to a laser rangefinder that has many different measurement modes.  Although using GPS would be the easiest way to survey an area, it can not always be trusted.  During the process of loading the data that we collected into ArcMap, we encountered some problems with getting the Bearing Distance to Line tool to work.  Through the consultation of online resources, as well as the collaboration of other students, we were able to work through this issue and display our results.  Finally, we were able to display the points that were derived from the distance and azimuth data that we measured on top of an aerial image.  This allowed us to compare our data points to the features that are visible in the image.  This showed good results for the most part, although it does appear that nine of the 50 points are incorrectly located in the street.    

Sunday, February 17, 2013

Construction of Balloon Mapping Equipment

Introduction
Our geospatial fields methods class will be conducting an exciting balloon mapping project this semester.  The project is composed of two different aspects, with the first being a balloon being launched above campus with a camera in continuous shot mode taking aerial images to then be mosaicked together to create a map.  The second aspect is a high altitude balloon launch, HABL for short, which consists of a balloon being launched into space with a camera taking a video of its travels.  This report will document the preparations and construction of materials for these projects.  Some very basic instructions with came with the balloon kit, so other websites were looked at to get a better understanding of the projects.
Here is the link to the website that our balloon kit was purchased from: http://publiclaboratory.org/wiki/balloon-mapping-kit
These two sites also had information on launching balloons:
http://archive.publiclaboratory.org/download/Grassroots_Mapping_English_2_0.pdf
http://the-rocketman.com/recovery.html

Methodology
Behind every successful field outing is a lot of preparation and planning.  To prepare for our balloon mapping projects, there were many tasks that needed to be accomplished.  These included: construction of mapping and HABL rigs, weighing of mapping and HABL rigs, parachute testing, creation of a method for implementing continuous shot on cameras, and testing of tracking device.  The class consists of about 20 students, and individuals were able to work on whichever aspect of the planning and construction they were most interested in.  This flexibility also allowed people to walk between the different projects that people were working on and get a good sense of what was going on in each phase of the construction.

Mapping Balloon
Two different groups worked on prototypes for the low altitude mapping rig.  The basic concept was to hang a camera from string in some sort of a plastic container.  The plastic container would have a portion cut out with the camera facing out in that direction.  The first prototype utilized a plastic jug with the bottom portion of it cut off.  The camera was then hung facing down with string as shown in Figure 2.

Figure 1. Side view of low altitude mapping rig prototype.

Figure 2. Bottom view of low altitude mapping rig prototype.
The second design is shown in Figure 3.  Here, a two liter bottle of soda is used to house the camera, which is secured to the bottle using zip ties.  The bottle is laid sideways, with a rectangle cut out of the bottom for a clear view for the camera.
Figure 3. "Hindenberg" prototype.
HABL
Since the HABL will be launched into space, the design is much more complicated.  A basic diagram can be seen in Figure 4.  Our design will use a styrofoam container generally used for minnows to house the camera and tracking device.  Connected to the payload is the parachute, which will deploy when the balloon pops.  Due to decreasing pressure in the atmosphere, the balloon will continue to expand until it pops.  Finally, the balloon can be seen on top.
Figure 4. Diagram of HABL rig.
As mentioned before, a styrofoam container used to hold minnows will be used to house the camera.  A small hole was cut into the bottom of the container for the camera to look out of (Figure 5).
Figure 5. Small hole for camera view.
The camera will be fastened to the bottom of the container using plastic zip ties.  High altitudes have very cold temperatures which can present issues to the electronic equipment.  In response to this, the HABL rig will have several handwarmers to keep the camera and tracking device from getting too cold.  To keep camera and handwarmers secure, a round piece of insulation was cut out to be placed on top (Figure 6).
Figure 6. Cutting the round insulation piece.
Weighing of Materials for Rigs
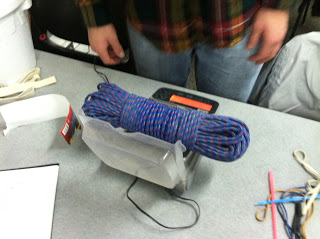
Determining the weight of materials used to construct the rigs is key to our project.  The helium balloon that will be used to lift the rigs can only support two pounds.  Therefore, it was important to know the weight of materials used, as well as the final weight of each payload.  One group of students was in charge of weighing and recording these weights (Figure 7).  Figures 8-11 show some of the materials used in construction.
Figure 7. Weighing materials for construction.
Figure 8. Zip ties.

Figure 9. Handwarmers.

Figure 10. Carabineer that will be used to connect the rope.

Figure 11. Rope that will be used to connect the payload, parachute, and balloon.
The following is a list of materials and their weight.
Balloon Mapping Weight Chart
Item Weight
Balloon (Orange) 315.5 g
Balloon (Red) 322.25 g
Black rubber ring (~1 inch) 8.25 g
Camera (Biggest, black) 392.17 g
Carabineer (blue with key ring) 4.79 g
Carabineer (silver with loop) 26.71 g
Coke Bottle (2 liters, empty, whole with cap) 50.86 g
Coke Bottle (Top, Label "1") 18.6 g
Coke Bottle (Top, Label "2") 12.5 g
Handwarmers (2 in package) 54.37 g
Jif Peanut Butter (No cap, empty, whole) 48.6 g
Memory card (16 gb) 2.16 g
Memory card (32 gb) 2 g
Minno Thermo with lid and rope 75.85 g
Mt. Dew (2 liters, empty, whole with cap) 52.08 g
Orange Camera (No memory card) 185.77 g
Parachute (blue and orange) 144.7 g
Pink Rope (1 meter) 1.15 g
Rainex Bottle (Empty, whole with cap) 141.36 g
Rope (150 ft.) 416.51 g
Rubber band (black, midrange) 2.8 g
Rubber band (blue, thin, medium) 2.37 g
Rubber band (Extra small, orange) 1.14 g
Rubber band (long, tan, thin) 4.7 g
Rubber band (long, white, wide) 14.4 g
Rubber band (short, white, wide) 5.69 g
Rubber band (thin, white) 3.5 g
Silver Camera (No memory card) 187.5 g
Styrofoam (Pink, 1.5 by 19 by 17.5 in) 200.3 g
Yellow Cord with buckle 106.5 g
Zip Tie (Black) 1.5 g
Zip Tie (long, multicolored) 1.16 g
Zip Tie (Short, multicolored) .31 g
7 Packs of Handwarmers 379.86 g
Cut Styrofoam+Minno Thermo 102.12 g
Green Bottle (With cannon, grey "Hindenburg") 239.69 g
Total Pay Load for High Altitude 944.34 g = Approx. 2.08 lbs
Parachute Testing
Another objective of our planning process was to test the parachute that would be bringing our rigs back safely to the ground.  To do this, a water bottle was filled up so that it weighed two pounds.  It was then put into the minnow bucket and attached to the parachute (Figure 8).
Figure 12.  Parachute testing rig.
The parachute was then dropped from a window on the fourth floor of the science building to the ground.  The rig was dropped three times from the fourth floor, and even though the parachute was not slowing the descent as much as we hoped, the minnow bucket did a good job of absorbing the impact from the ground.  Here is a video that was filmed from the ground of the rig being dropped.

Continuous Shot Method for Cameras
It was determined that the HABL would have the camera in video mode, while the low altitude balloon's camera would be in continuous shot mode for better quality images that would be used in the mapping process.  A test was performed to see which method used up more storage space.  A video was taken for 20 seconds, and then continuous shot mode was used for 20 seconds, with the camera taking a picture every second.  When comparing the file spaces, it was found that the continuous shot mode used up a considerable more amount of file storage.  In order for a camera to be in continuous shot mode, the button for taking a picture must be held down.  To accomplish this during the flight of the balloon, a rubber band will be put around the camera to hold the button down (Figures 9, 10).
Figure 13. Orange rubber band wrapped around camera to hold the button down.

Figure 14. View of how the camera will be hung in the low altitude balloon rig.
Testing of Tracking Device
A tracking device is necessary in these rigs because winds could blow them many miles.  Our class obtained a small GPS tracking device that can be tracked using an iPad.  The device was tested by some classmates taking a walk outside with it around campus, while others watched their path on the iPad.

Discussion
This project provided our class with a lot of issues that we needed to discuss and solve.  We were not given a specific set of instructions, so we had to consult resources and use our creativity to construct the two different balloon rigs.  This also led to a lot of collaboration between the whole class.  People had to communicate what part of this planning, testing, and construction process they were going to be involved in, as well as ideas they might have had.  This planning day should help us immensely when it comes to actually launching our balloons.  Only a few last minute tweeks to the designs should have to be made.  It also gives us confidence that all of our equipment works properly.  Hopefully, all of this preparation will make the launching of the balloons a success.  I believe that both aspects of this balloon project will prove to be very exciting and interesting.  This is a great opportunity to be involved in a cool scientific project that hopefully produces good results.

Conclusion
As you can see, our class did a lot of work in preparation for the balloon mapping projects that we will be participating in.  In this preparation, we constructed two prototypes for the low altitude balloon mapping project, constructed the HABL, weighed all of the construction materials to ensure the balloon would be able to support the weight, tested the parachute, and developed a method for keeping the camera in continuous shot mode.  The balloons will be launched towards the end of the semester when the weather is nicer.  The results of this project will be uploaded then.

Sunday, February 10, 2013

Lab 2. Terrain Model Redo

Introduction
The second activity for class was to redo and improve the survey of a terrain surface that was done the previous week.  Each group was to discuss ways to improve our methods, then re-conduct the survey and use the new data to create an elevation surface.  Various interpolation methods would be used and compared, including IDW, Kriging, Natural Neighbor, Spline, and TIN.  

Methodology
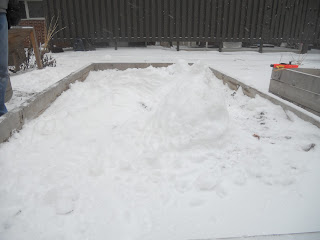
Our group went about this project using the same method for surveying the terrain surface as last week, with the exception of taking measurements at every 5x5 cm intersection as opposed to the 10x10 cm measurements that were previously taken.  This was decided because our group wanted to have a more accurate and better model representation of the actual surface.  Over the course of the week, weather factors such as rain, temperatures above freezing, and snow had altered the surface.
Figure 1. Fresh snow on top of terrain surface in planter box.
Therefore, the surface was rebuilt to resemble the surface that was created last week.  The planter box measured approximately 1.2 meters wide, and 2.4 meters long.  The southwest corner of the planter box was designated as the origin, and five centimeter increments were measured along both axes.  String was stretched over the surface along the X-axis to aid in the measuring process.
Figure 2. Measurement of five centimeter increments along X-axis.
Figure 3. Oblique view of terrain surface and strings spanning entire length of planter box.
To measure the Y-axis, two boards were placed on the edges of the planter box and a meter stick was extended between them over the surface.  Measurements were then taken at the intersection of the meter stick and strings.
Figure 4. Measuring the elevation of the terrain surface.
After the surveying was completed, the XYZ data was entered into Excel.  Because the measurements that we took were from the top of the surface to the meter stick that was laid over the planter box, each value was then subtracted from the highest value to ensure all positive elevation numbers.  After the calculations in Excel, the point data was imported into ArcMap and used to create rasters using various interpolation methods.  The rasters were then imported into ArcScene and displayed in 3-D.  
Figure 5. Excerpt of XYZ data.
Discussion
The following images show the terrain surface that we created in 3-D using IDW, Kriging, Natural Neighbor, and Spline interpolation methods.  Some noticeable features of the surface include the plains in the southwest and northeast corners, the L-shaped ridge in the middle of the surface, as well as the low valley that seems to surround the ridge.  It was very interesting to see the difference between the elevation rasters that were created with the various interpolation methods.  The surface that was created using IDW has odd circle shaped bumps at each point where a measurement was taken.  The IDW method estimates cell values by averaging the values of sample points in the neighborhood of each processing cell.
Figure 6. IDW
The next interpolation method used was Kriging.  Kriging is a geostatistical method of interpolation that creates a surface by examining nearby points.
Figure 7. Kriging 
Natural Neighbor is a method that applies weights based on proportionate areas to interpolate a value.
Figure 8. Natural Neighbor
Spline is an interpolation method that estimates values using a mathematical function that minimizes overall surface curvature, which results in a smooth looking surface.
Figure 9. Spline
The Kriging and Natural Neighbor surfaces do not contain the odd circle shaped bumps that the IDW has, although the top of the ridge is rather pointed.  I believe that the Spline surface is the most aesthetically pleasing model that was created.  The surface that we created did not have any pointed edges, as the surface was made out of snow.  The top of the ridge is a little more rounded than the previous two interpolation methods, and best models the surface that we created.  A TIN was also generated, but because of its poor aesthetic look and representation of the data, it was not included in this report.

Conclusion
I really enjoyed this activity, and was able to take a lot away from it.  It challenged us to think critically about a method for surveying terrain, as well as what could be done to improve the process.  Completing this project the second time around was a lot easier.  We improved the surveying process by laying a meter stick over the two boards instead of a string that was attached to them.  We also switched from measurements being taken every 10 centimeters to every 5 centimeters.  Our group discussed that the 10x10 cm measurements that were previously done were too coarse for a surface of this size.  The 5x5 measurements took about a half hour longer to complete, but greatly improved accuracy.

Sunday, February 3, 2013

Lab 1. Terrain Model

Introduction
The objective of this lab was to create a model terrain surface and survey the area without using high tech equipment.  In order to accomplish this, a coordinate system would have to be developed, as well as a system for measuring the elevation of the surface.  No specific instructions were given, although a tape measure, meter stick, and string were given so critical thinking was a must.  This lab also represents the collection of data in the field, with the analysis on computer software to come later.

Methodology
This lab utilized a rectangular planter box located in the Phillips courtyard.  A terrain made out of snow was created in the box, consisting of plains, mounds, ridges, and valleys.

The next step was to design a coordinate system that would be used to survey the terrain.  The shorter sides were deemed the X-axis, while the long sides were designated as the Y-axis.  Ten centimeter increments were chosen, and strings were stretched across the long way of the planter box.  To make accurate height measurements, a string spanning the short way of the box was strung on top of two boards.  Then, the boards were slid down the box to marked 10 cm increments.

The measurements were made by placing a meter stick at the top of the terrain surface at each intersection and measuring to the top of the string spanning the X-axis.

The measurements were then recorded and added to an Excel spreadsheet.  Because the surface was measured from the top of the terrain to the strings above, these measurements were actually the inverse of the elevation of the terrain.  To correct this, each inverse measurement was subtracted from 25 (25 cm for the distance from "sea level" to top of the boards used to measure).  

Discussion
The raw data shows the terrain elevation at each 10 cm interval that was measured in the planter box.  It will be interesting to upload the data to ArcGIS and see the three dimensional model and compare it to the pictures of the terrain that was created in the snow.  After completing this lab, I am concerned that the 10x10 cm measurements we took might be too coarse to accurately represent the data.  A more precise measurement increment, such as 5x5 cm, might have been the better option.  

Conclusion
I found this to be a very stimulating and interesting lab to complete.  There were no specific instructions given, so our group had to come up with the process used to survey the terrain surface.  It really stressed the importance of collaboration to accomplish our goal.  One concern I have over this lab is that the 10-x10 cm measurements that we used might be too coarse.  It was also very interesting to see the different ways that people think and ideas that they contribute.  Finally, as most people that use technology often know, there is always the chance that technology can fail at any time.  This exercise was useful to display the importance of understanding concepts and the ability to think critically and on your feel to solve problems.