Our geospatial fields methods class has been thinking conceptually about and working on an aerial mapping project of the University of Wisconsin - Eau Claire campus for a while. Early on in the semester we did extensive research on the topic, and found that there was not a lot of information about it on the internet. Therefore, we have been almost "winging it" and coming up with ideas on the procedure by ourselves. Now that the weather has warmed up a little bit, we were able to finally put the project into action.
Methodology
Day 1:
We previously had constructed contraptions out of two-liter soda bottles to hold the camera in for the project, but those ideas have since been scrapped. A small styrofoam container is now being used to house the camera for the project. A hole was cut out of the bottom of the container for the camera to take pictures through. The first task of the day was to inflate the balloon. This was done by attaching a hose from a helium tank and inserting it into the opening of the balloon (Figure 1).
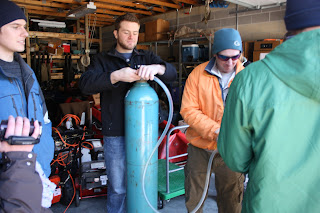 |
| Figure 1. Helium tank/hose |
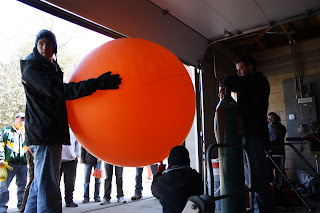 |
| Figure 2. Inflating the balloon |
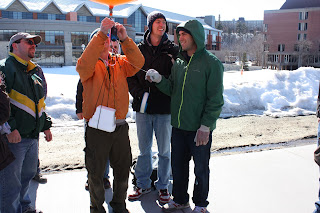 |
| Figure 3. Attaching the camera contraption to the balloon |
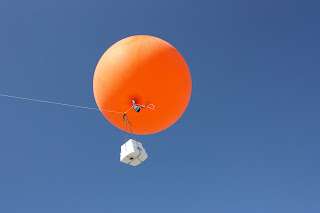 |
| Figure 4. Balloon being let out on the string |
The map that I made using this site can be found here: http://mapknitter.org/map/view/uweccampus.
Day 2:
We decided to construct a different system for housing the camera for the second class of balloon mapping. The winds during the previous class kept swinging the styrofoam container around, causing many images to be taken at oblique angles. In order to make the more aerodynamic, the camera was attached to an arrow (Figure 5). This would allow the wind to flow around the device, and hopefully reduce the amount of swinging around from side to side up in the air.
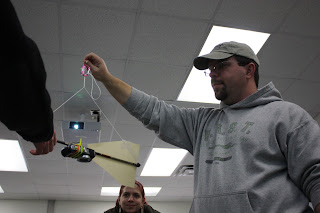 |
| Figure 5. New device to hold the camera |
The following videos document the process of inflating the balloon and attaching the camera to the string on the balloon. This time, a metal ring instead of a rubber one was used to secure the various parts together.
Georeferencing is a relatively straight-forward process in ArcMap. The first step is to obtain a reference image for the desired area. The images that you want to georeference are then added to the document. It is best to find images that are taken looking straight down towards the ground to limit the amount of distortion. Enough images should be selected so that there is about a 60% overlap in the area covered by the image. The georeferencing toolbar is then turned on and used to select the image that you want to georeference. Using the add control points button, a point on the image is clicked, followed by clicking on the corresponding spot on the reference image. Each image should have at least nine control points added to it to ensure an accurate georeference. Figure 6 shows an image being georeferenced with its control points displayed.
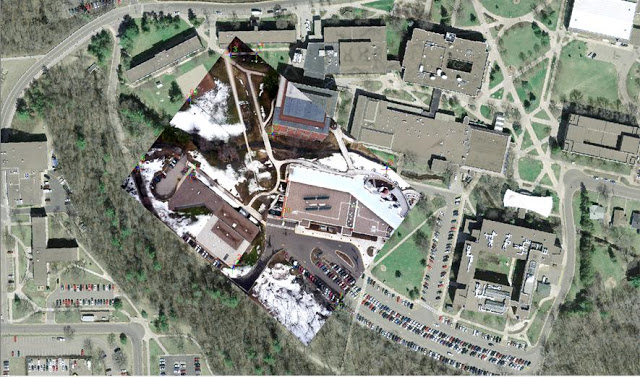 |
| Figure 6. Image with control points |
 |
| Figure 7. Mosaic |
One issue that arose during the geoferencing process was the string being visible in some of the images. I tried choosing images where the overlap would remove the string, but it is still visible in two of the images in the mosaic.
|
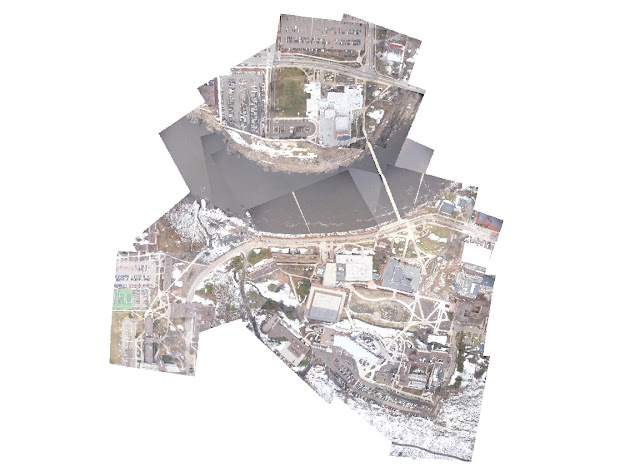 |
| Figure 8. Mosaic of Entire Campus |
Discussion
We were able to take away quite a bit of knowledge from the first day of balloon mapping. It was a very windy day, which influenced the quality of images we got, and ultimately led to the loss of the balloon. Therefore, the weather conditions must be considered for a project like this. A sunny day with calm or gentle winds would be ideal. When the balloon was up in the air, the wind tossed around the styrofoam box that contained the camera. This led to the camera taking many pictures at odd angles. Those images were distorted, and not useful at all for creating a mosaic. Because of that issue, we decided to create a new contraption for housing the camera for the second day of balloon mapping utilizing an arrow. This was much more aerodynamic, and we were able to get better pictures facing straight down. The high winds also affected the flight of the balloon. Rather than rising straight up, the balloon was pushed way off to the side (Figure 4). This severely shortened the elevation of the balloon up in the air and limited the expanse of coverage of the images taken by the camera.
Due to recent construction on campus, there are no reference images that are up to date. This made the georeferencing of some areas very difficult. A few members of the class attempted to take ground control points using various GPS units. There was a discrepancy in the location of points among the various units so I chose not to use the points during the georeferencing process.
Conclusion
The two balloon mapping sessions turned out to be very successful, despite losing the balloon on the first launch. We were able to get many good images of campus to georeference and mosaic together. The first class of balloon mapping also provided us with a lot of information to make the second attempt much better. We learned what effect the weather could have on a project like this, and created a better device to hold the camera for the second launch. In addition to using ArcMap to georeference and mosaic the images, I was also introduced to Map Knitter, which is a website where you can add images together on top of an aerial image.
No comments:
Post a Comment